StandUp! For healthier lifestyle.
The human body is designed to move. For thousands of years, that’s exactly what we did. In the mid-20th century rapid technological advances (think: cars, TVs, computers, etc.) began chipping away at physical activity and people became increasingly sedentary. Technology has also influenced the way we work, most of us being tied to the chairs for long times throughout the day. In the same time, we believe that technology can be used to fight (work-related) sedentary behavior.
This project proposes a software-based health intervention for reducing sedentary time by looking into your daily active screen time. Active screen time is the time we spent in front of our computer. Reducing the daily screen time is the first focus of this software. We understand that lowering the screen time can be challenging: for example a lot of you are bound to the screen for work. That is why our second focus point is changing the way you manage your active screen time. This involves dedicating more moments for short breaks, that help avoiding prolonged screen time cycles. Understaning the concept of prolonged screen time cycles is very important. Prolonged screen cycles are any active screen cycle longer than 45 minutes, that are especially harmful for your health. Our software will help you reducing the number of prolonged screen cycles, through observation and intervention.
Curious how it works? Keep scrolling for the software details...
The Software
The StandUp! software is a Chrome browser extension that replaces your regular new-tab screen with a dashboard-like screen where you can observe and get informed about your screen (sedentary) time behaviour.
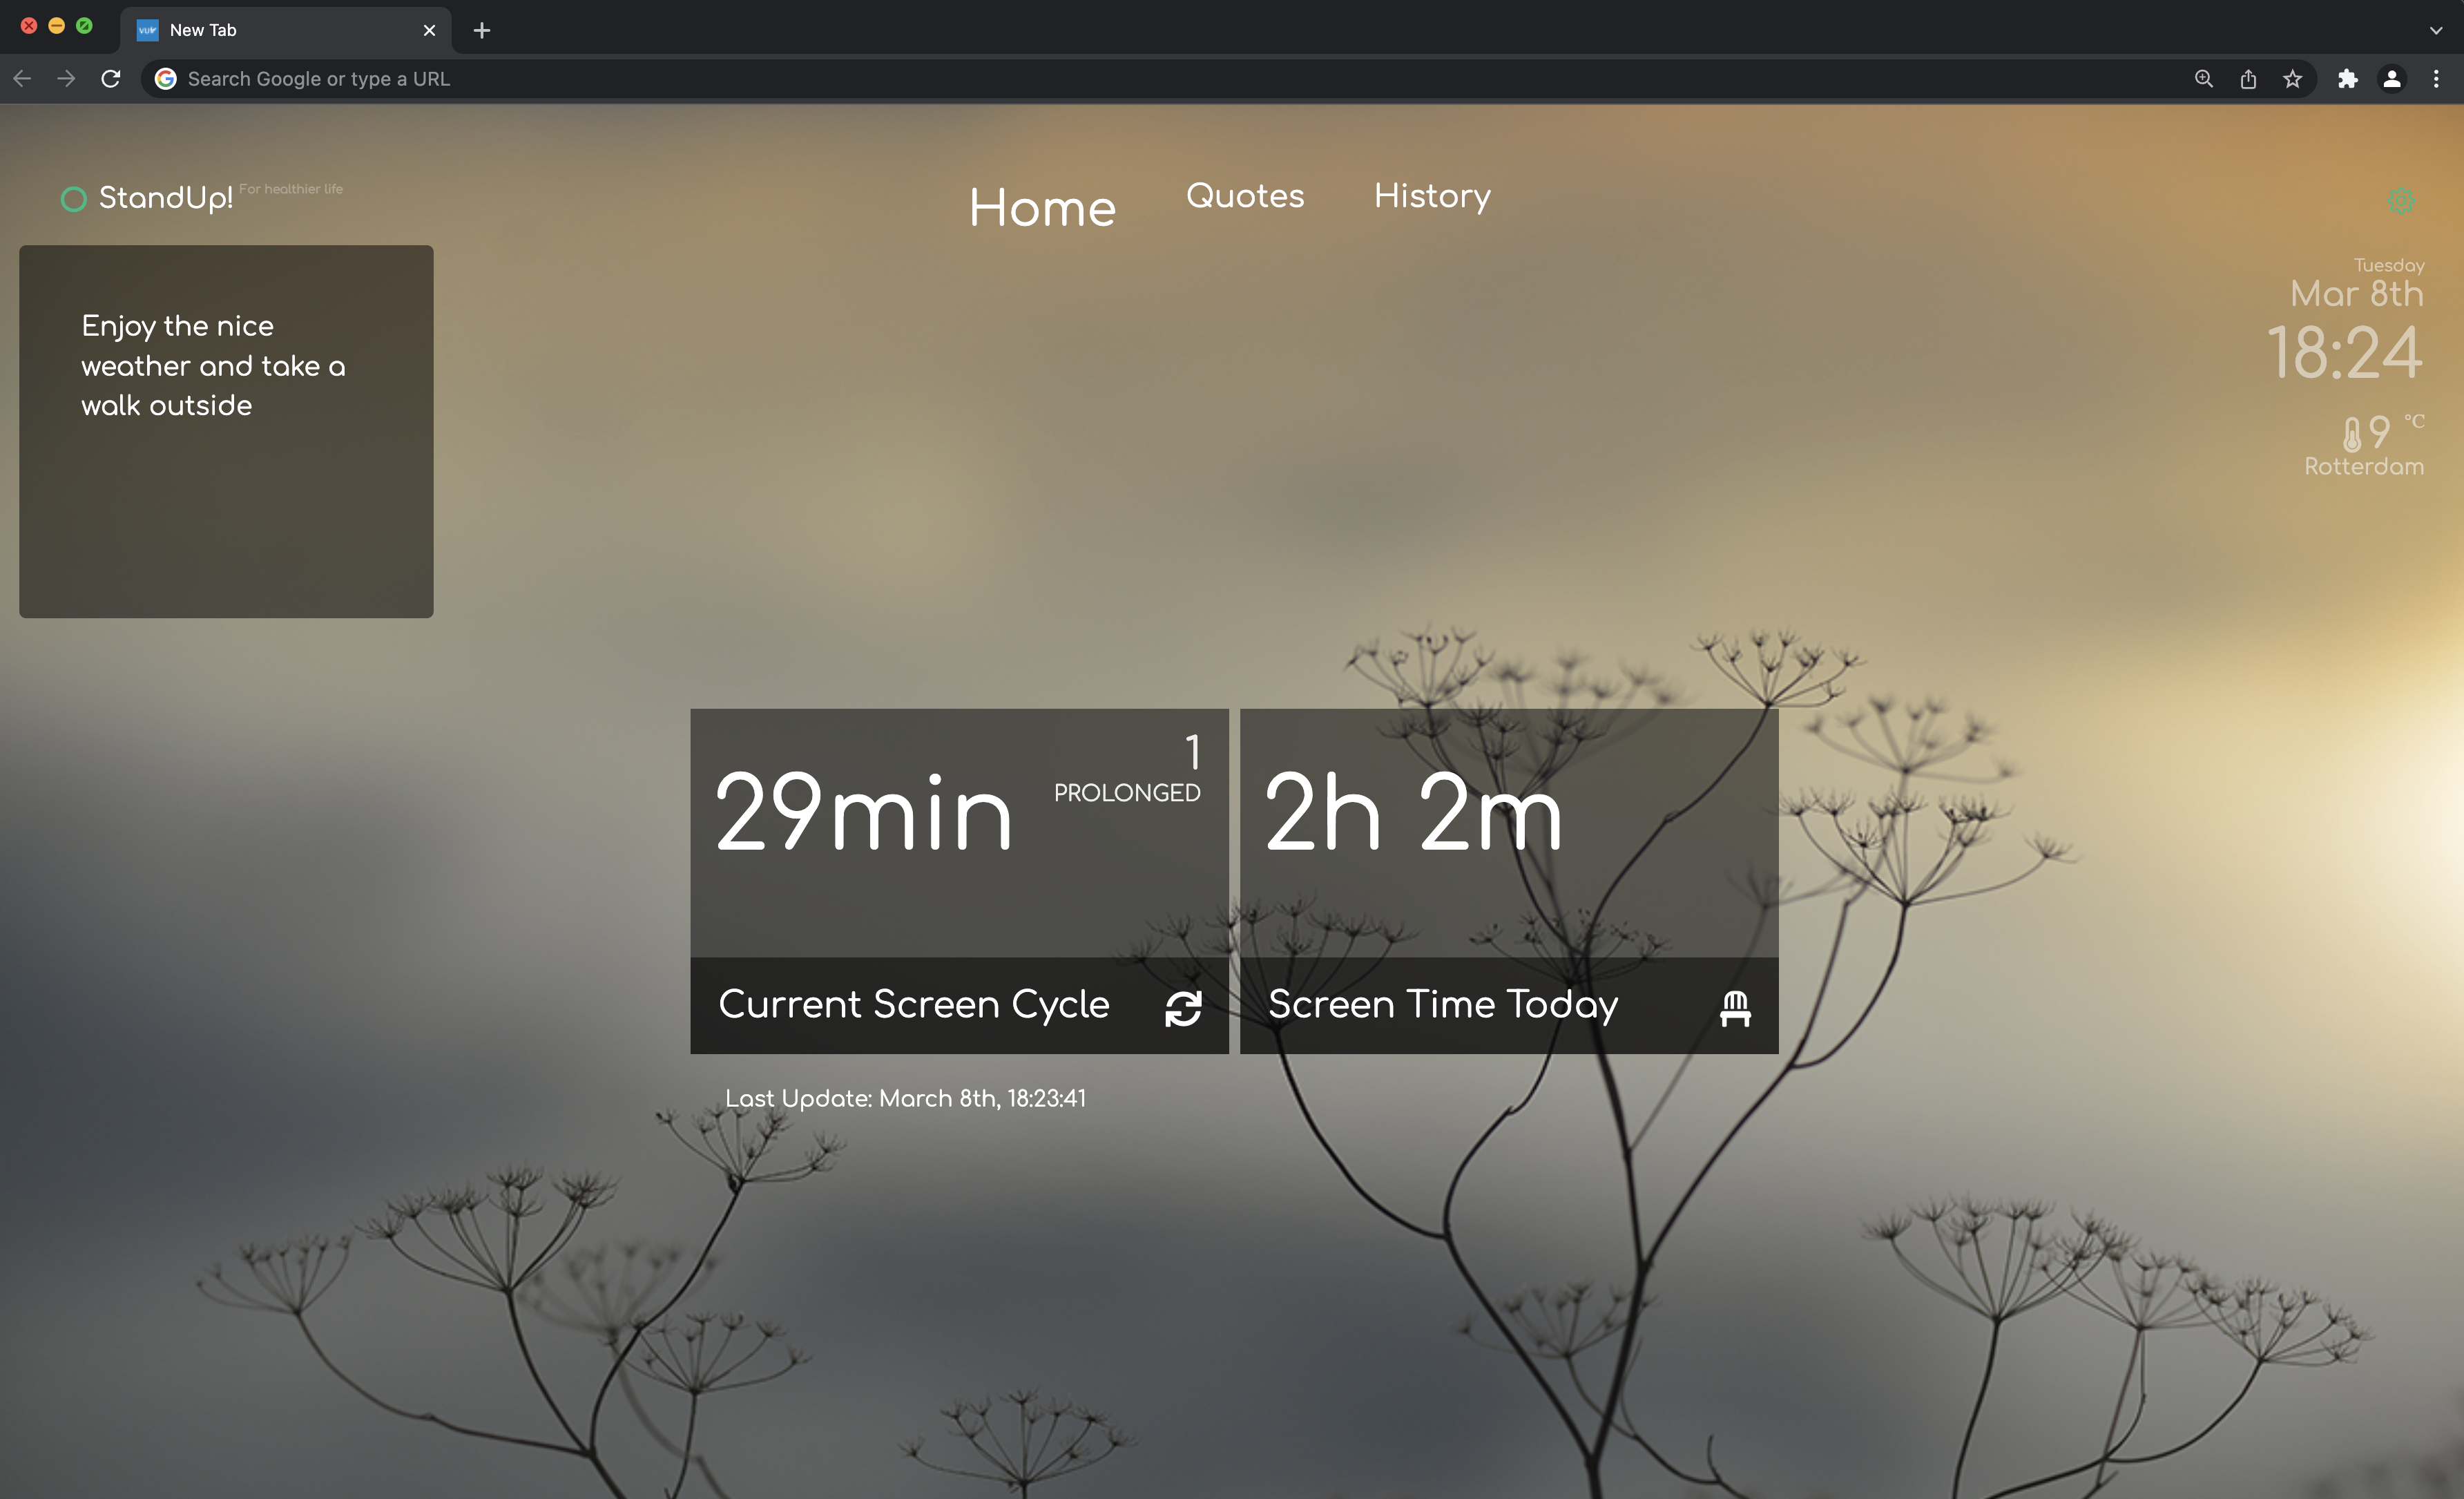
The software is composed of three modules (screens): the home screen, quotes and history screens. The home screen displays your daily data. The quotes screen displays inspirational quotes regarding sedentary behaviour. The history screen is where you can reflect on your sedentary behaviour and check how you are doing throughout the days/weeks.. There is much more to it, but let's not ruin all the fun. You will discover all the details by using the software!
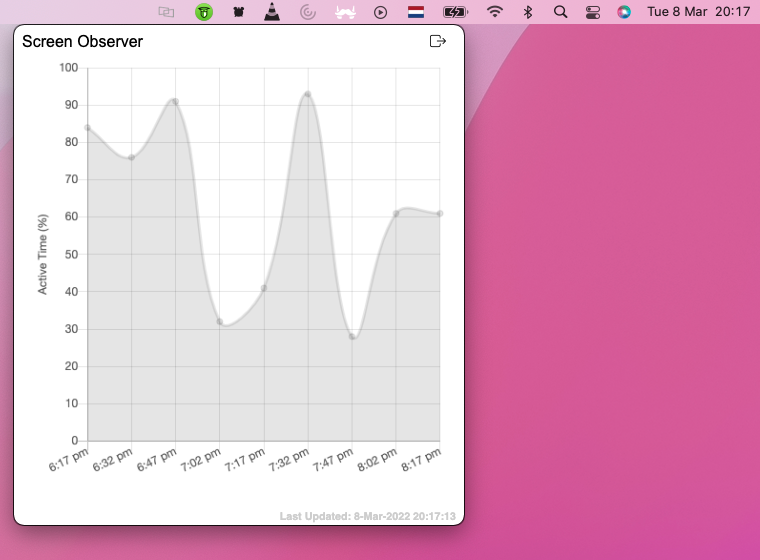
Besides the Chrome extension above, you will need to install another minimal software that we developed especially for data collection called the Screen Observer. This desktop software collects data about the states of the computer where it is installed. We collect the following computer usage data (states) throughout the day: system idle status changes, lock/unlock screen, resume/suspend computer, and computer shutdown times. The system idle status change state, records the time when the computer moves from active usage (keyboard/mouse use) state to inactive usage state, and vice versa. Our algorithms combine these state data to model your screen cycles and breaks. The StandUp! dashboard uses this data to show useful information and plots to you! Having both software products installed is essential for a good user experience.
Our priority is to offer ultimate data privacy and transparency to our participants. We collect minimal amount of data, and only related to computer states. No personal data is being collected. All the participants are anonymised, with a given 16-digit registration ID. All the data is stored on our private and secure VU Amsterdam servers. Each participant can request their data at any time, and withdraw from the experiment. The code related to this project is available on Github.
Excited to participate? Scroll down to see what you need to do.
The experiment is organized in five weeks. We require your participation during this period of time. In reality, there is not much you need to do besides installing the two software products. We have developed a low-intrusive software that won't distract you from your regular work-life. You will see the StandUp! dashboard only on opening new tab when using your Chrome browser. No smartphones, no wearables. Minimal number of notifications that you can always turn off. We are aware that you have a busy work week, but we truly hope that this low intrusive tool will be helpful to at least observe and think more about your sedentary behaviour patterns. Below find the timeline of your participation.
Week 1: Introduction Period
Install the Screen Observer software. Fill-in a five minute intake questionnaire.
Week 2 - 5: Intervention Period
Install the StandUp! extension software. Anytime you use your Chrome browser, you will see your screen time data details. Keep the Screen Observer software running!
Post-experiment
Fill the exit questionnaire (max 10 minutes). Your feedback is much appreciated. We will also ask for data donation of your activity tracker (google fit, wearables..). We would like to use this data to validate our algorithms accuracy. This is purely optional!
Sedentary Behaviour Facts
How much we sit?
The average person is sitting (aka sedentary) 12 hours a day.
Why is it important?
Physical inactivity is the 4th risk factor for global mortality. 3.2 million deaths a year are related to physical inactivity
Less sit = more focus
71% of employees reported feeling more focused after reducing sitting time by 1 hour.
Short breaks rock!
10 minutes of movement is all it takes to increase mental focus.
Long sitting risks
Sitting for 6+ hours during the workday puts you at a higher risk for anxiety and depression.
Raising awareness
Only 15% of people are aware of the worldwide sitting disease.